
MEASURE: Six Steps to Student Success
• Mission
• Elements
• Analyze
• Stakeholders-Unite
• Results
• Educate
WHAT IS MEASURE?
MEASURE is a six-step accountability process that helps school counselors demonstrate how their programs impact critical data, those components of a school report card that are the backbone of the accountability movement. Implementing a
MEASURE stands for: Mission, Elements, Analyze, Stakeholders-Unite, Results, Educate.
WHY USE MEASURE?
MEASURE helps you organize your work to show that you are helping to drive critical data elements such as promotion rates, attendance, test scores, postsecondary going rates etc. by developing specific strategies and collaborating and teaming to connect school counseling to the accountability agenda of today’s schools.
Step ONE: Mission
What Do I Need to Do?
Connect the design, implementation, and management of the school counseling
program to the mission of the school and to the goals of the annual school improvement plan.
MissionConnect your work to your school’s mission in keeping with the ASCA or your state’s comprehensive school counseling model. |
Your school or department’s mission statement is: |
Step TWO: Element
What Do I Need to Do?
As a member of your school’s leadership team, identify and examine the critical data elements that are important to your school’s improvement plan. Critical data elements usually can be found on the school’s district or building report card. School counselors have ready access to data in areas that contribute to achievement such as course enrollment patterns and attendance.
EXAMPLE: Let us assume that the number of students in your school district continuing on to postsecondary educational institutions is not as strong as your colleagues, administrators and community believe it should be.
The critical data element to address could be the postsecondary going rates for your school district, which have been holding steady around 50% for the last five years. Establish the baseline by identifying the data point that you will use for comparison to measure change.
ElementWhat critical data element are you trying to impact? (Examples include: grades; test scores; attendance; promotion rates; graduation rates; postsecondary-going rate; enrollment into honors or AP courses, special education; discipline referral data; etc. |
Element: Post secondary going rate |
Although this is a high school example, you can substitute test scores, attendance, or any other data element that is important to your school’s improvement plan.
EXAMPLE
Element: test scores
Baseline: 60% of 4th graders are proficient in Math
Goal: Increase the number of 4th graders proficient in Math to 65%
EXAMPLE
Element: attendance
Baseline: 89%
Goal: Increase the attendance rate by 2% to 91%
What Do I Need to Do?
Analyzing the data element helps to better understand which groups of students are not succeeding and why. It is important to disaggregate the critical data elements on which you are focusing, and to look at them in terms of gender, race/ethnicity, socioeconomic status, and perhaps by teacher to shed light on areas of success or on areas in need of attention.
| Analyze the data element. You can use percentages, averages, raw scores, quartiles, or stanines. You can aggregate or disaggregate the data to better understand which students are meeting success. You can disaggregate by gender, race, ethnicity, socio-economic status or in a multitude of ways to look at student groupings. | ||||||||||||||||||||||||
EXAMPLE
Disaggregated post secondary going rate
Disaggregated data for students with formal career and educational plans
|
You can disaggregate the data in a number of ways such as gender, ethnicity, SES, home location (zip code), teacher or counselor assignments, course taking patterns, feeder school patterns, etc.. This information can be gathered by accessing the student information management system that your school uses.
As part of the school leadership team trying to positively impact this data, what else do you need to know about this data? You can substitute attendance, test scores, or for the post secondary rate as we did in ELEMENT. What are the key issues? How do you want this data to look next year and in the subsequent years? How will the school counseling program contribute toward positively improving these critical data
elements and connecting the work of school counselors to better results for students?
What Do I Need to Do?
Identify stakeholders to become part of a team to be involved in addressing the movement of the critical data elements. If possible, use an existing school action committee. Accountability for school counselors is about collaborating with other stakeholders and avoiding tackling issues in isolation. Examples of stakeholders are:
Internal Community External Community
Principal Parent
Teacher Business Representative
School Board Member Faith Representative
EXAMPLE: POST SECONDARY RATES
The table below gives a high school example of stakeholders and strategies that could be used to increase postsecondary going-rates. Similar tables can be created for middle and elementary school based on the target results from Step Three.
____________________________________________________________________
STAKEHOLDERS - UNITE to develop strategies to impact the data element
Beginning Date: September
Ending Date: June
Stakeholders |
Strategies |
School Counselors |
|
Teachers |
|
Administrators |
|
School Psychologists |
|
School Social Workers |
|
Clerical Staff |
|
School Clubs |
|
Parents |
|
Volunteers |
|
Business Partners |
|
Community Agencies |
|
Colleges and Universities |
|
STEP FIVE: RESULTS
What Do I Need to Do?
If the targeted results were met, there is still reflection and refining to do. Did the results of everyone’s efforts show that the interventions and strategies successfully moved the critical data elements in a positive direction? If the targeted results were met, set new goals, add new strategies, and replicate what was successful
If the targeted results were not met, the next step would be to reanalyze and refocus the efforts to determine why the interventions were unsuccessful in moving the data in a positive direction. The next steps will be to revise the action plan for the following year and to continue to move the critical data elements in a positive direction.
EXAMPLE
Results: Restate your baseline data. State where your data is now. Did you meet your goal? Restate baseline data: Results (data now): Met Goal: Yes X No ____
|
||||||||||||||||||||||||||||||
Questions to consider as you examine results and revise your MEASURE: Which strategies had a positive impact on the data? Which strategies should be replaced, changed, added? Based on what you have learned, how will you revise Step Four “Stakeholders-Unite?” How did your MEASURE contribute to systemic change(s) in your school and/or in your community? We are beginning to establish a post secondary culture in our high school. Many of our teachers asked to establish an Alumni Day. They want to wear a shirt or hang a pennant from the college that they attended. |
What did we learn from this process?
- critical data element analyses helped us focus our efforts;
- district wide systemic change issues must begin in elementary school;
- collaborative effort made the change happen;
- the school counselors’ commitment as key players in school improvement was well established and acknowledged;
STEP SIX: Educate
What Do I Need to Do?
Complete your report card to show the changes in the targeted data elements that show the positive impact the school counseling program is having on student success. Publicizing the results of an effective school counseling program is a vital step in the accountability process and key to gaining support for your school counseling program.
EXAMPLE: Educate others as to your efforts to move data. Develop a report card that shows how the work of the school counselor(s) is connected to the mission of the schools and to student success. Below is an example of a report card. |
|||||||||||||||||||
Principal’s CommentsPreparing students to choose from a wide array of options after high school is part of our district’s mission of academic success for every student. Our counselors worked very hard this year to impact the school board’s desire improve the post secondary going rate for every student. They looked at the important data elements that contribute to improving our student’s futures and used their leadership, advocacy, teaming and collaboration skills to make a positive difference. School Improvement IssuesPost secondary going rate is 50%. StakeholdersParents: Assisted in establishing a tutoring program; created a phone chain to call parents to remind them of important school events. SYSTEMIC CHANGESMeasurable results showed how the |
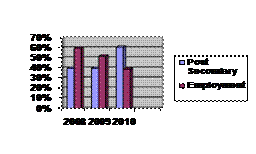
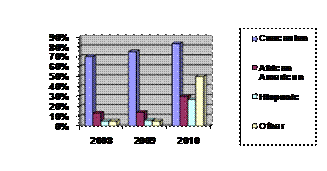
ResultsComparative Changes In Postsecondary Rates
Faces Behind the DataA parent approached her child’s school counselor at the end of the graduation ceremony. I didn’t think my child’s dream of going to college was going to happen this year. I am recently divorced and did not realize that financial aid would be available. Thank you for keeping after both us to fill out the FAFSA so that it wasn’t too late to get some help. |
||||||||||||||||||
 2010 DATA SUMMARY
 The Educate step in MEASURE has been adapted with permission from the Student Personnel Accountability Report Card sponsored by the California Department of Education and Los Angeles County Office of Education.